WireLens is born
Every Livewire developer has hit the same wall.
You're deep into a feature. Something re-renders when it shouldn't — or doesn't re-render when it should. You open Chrome DevTools, stare at the Network tab, and squint at a wall of JSON. You add dd() calls. You dump state to the browser console. You refresh. You repeat. Twenty minutes later you find it: a property was dirty that you didn't expect, or a lifecycle hook fired twice because a child component mounted before the parent finished hydrating.
This is the problem WireLens is built to solve.
Why existing tools fall short
Chrome DevTools is an incredible piece of engineering — but it speaks HTTP and JavaScript. Livewire speaks a higher-level language: components, properties, lifecycle events, hydration, dehydration, snapshots. There's a translation layer between what DevTools shows you and what Livewire is actually doing, and that gap is where debugging time disappears.
Vue and React both have first-class DevTools extensions that understand their component model. You can inspect component trees, watch state change in real time, and replay events. Livewire developers have nothing equivalent. Until now.
What we're building
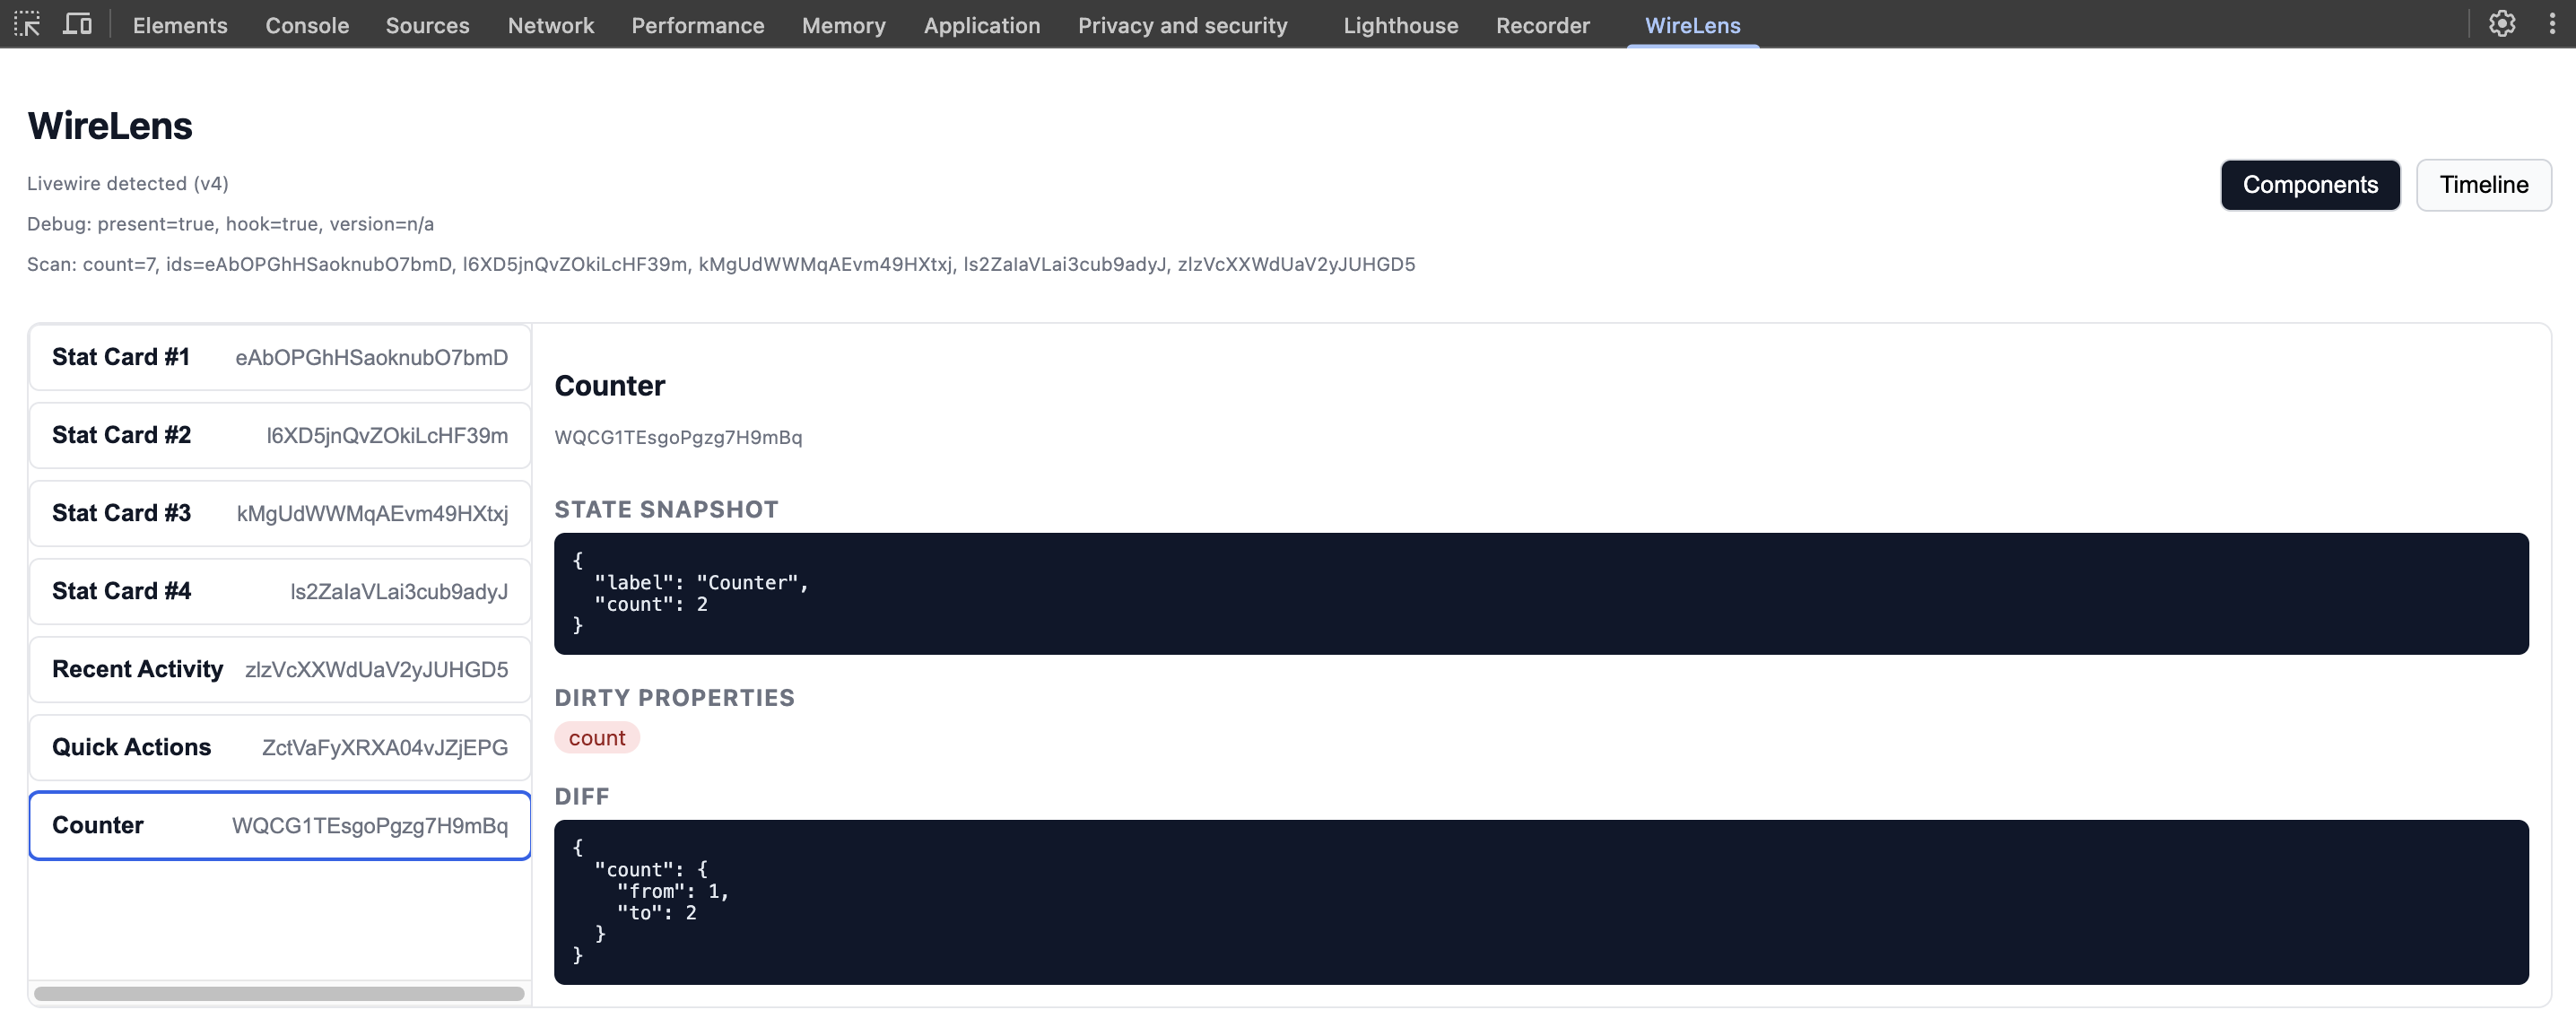
WireLens is a Chrome DevTools extension purpose-built for Livewire 4. It hooks directly into Livewire's JavaScript layer and gives you a native DevTools panel that understands your application at the component level.
Component Tree
See every active Livewire component on the page in a collapsible, inspectable tree — exactly like the Elements panel, but for your Livewire component hierarchy. Click any component to select it and inspect its current state.
State Inspector
When you select a component, you'll see all of its public properties laid out clearly. When a network request updates a component, WireLens shows you a before/after diff — exactly which properties changed, what they were, and what they became. No more guessing what a response payload did to your component.
Timeline Panel
Every Livewire lifecycle event is logged to a timeline: when a message was sent, when it was processed by the server, how long it took, which components were affected, and what changed. You can filter by component, by event type, or by duration to find slow requests instantly.
Event Debugger
WireLens captures every $dispatch, $dispatchTo, and $dispatchSelf call and shows you the event name, payload, and which components received it. Tracing event-driven bugs across components becomes trivial.
Who it's for
If you build production applications with Livewire, WireLens is for you. It's especially valuable on larger applications where components nest deeply and events flow between them — the kind of codebases where a single re-render can touch a dozen components and you have no visibility into why.
It's also for developers learning Livewire. Watching state flow through your components in real time is one of the fastest ways to build an accurate mental model of how Livewire works.
How we're building it
WireLens intercepts Livewire's internal JavaScript hooks — the same ones Livewire uses to fire its own lifecycle callbacks. This means zero changes to your application code and no Livewire version constraints beyond Livewire 4. Install the extension, open DevTools, and start debugging.
The panel itself is built with Vue 3 and Vite, designed to feel indistinguishable from native Chrome DevTools. Dark mode, the same monospace fonts, the same panel layout conventions. It should feel like it shipped with the browser.
What's next
This landing page and waitlist are day one. Add your email and we'll notify you when WireLens is available — we're building in public, so you'll hear from us as each piece ships.
Development starts now.